CT Metro Areas
Connecticut’s Metro Area: the New Normal
After 4 years the Covid-recovery is highly asymmetric across the states. Figure 1 shows the performance of Connecticut alongside its neighbors, New York and Massachussetts and two high-performing states: Texas and Arizona.
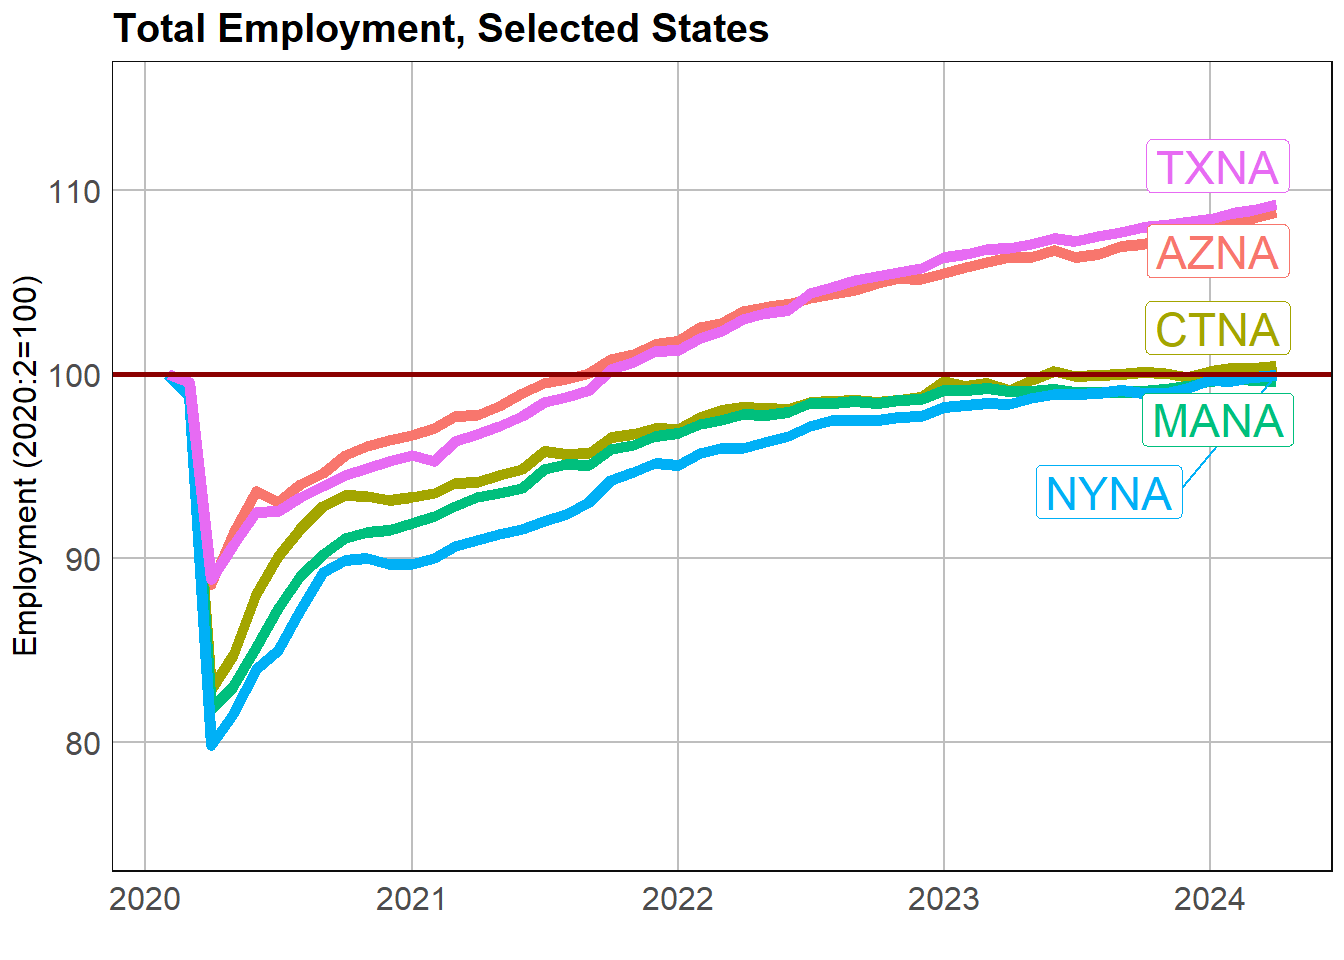
The employement series presented in the figure above have been rebased to equal 100 in February 2020. February 20 denotes the start of the Covid-recession. The purpose of indexing series is to facilitate comparisons. Indexing allows us to easily gauge and see how a particular state has fared over time; and it allows us to compare its performance to other states on a comparable basis. The series run from February 2020 through March 2024. Thus, an index of 109 in March 2024 indicates an improvement of 8 percent over the period, its post-Covid performance.
Connecticut and other states display a poor absolute and a poor relative employment performance. Anything below the horizontal line represents underperformance. CT, alongside its neighbors is barely breaking even but sorely lagging Texas and Arizona.
This begs any number of questions. First, why do the laggards underperform? Why have the underperforming states failed to rebound or taken so long to regain their footing. Second, are the laggards focusing on the appropriate policies? For that matter, what are the appropriate policies and policy variables?
It would seem almost self-evident that post-recession decisions and proper stabilization policies require an understanding of the factors that impact the recovery time of an invididual state’s economy. These could be particular to a state, a region; it could be federal - impacting all and unavoidable; or a combination of both. Understanding this situation may carry even more urgency given the plausible imminence of a new recessionary period. We turn to look inside Connecticut.
A Marked Performance Variation can be Found Across Connecticut Metros
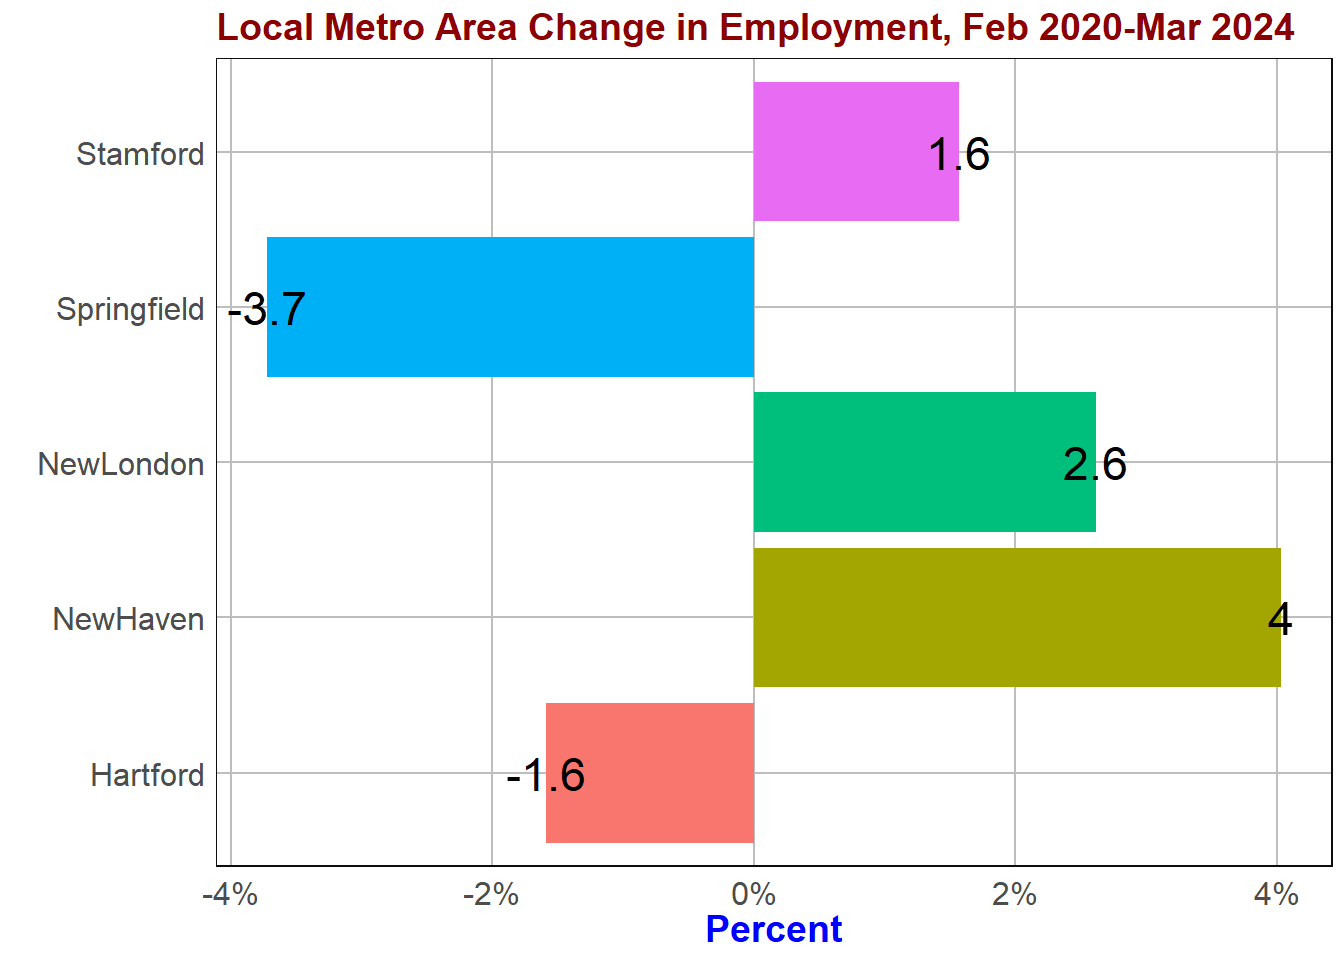
A similar recovery unevenness to the one displayed by the States can be found within Connecticut. Connecticut’s population hubs have only recently regained the level of jobs they had at the beginning of the Covid-period. Figure 2 shows relative Employment performance for the following Connecticut metro areas:
+ Bridgeport-Stamford-Norwalk

+ Springfield, MA-CT

+ Norwich-New London-Westerly

+ Hartford-West Harford-East Hartford

+ New Haven
The variation across metro areas is significant.
 It is useful to examine our performance with other Metros. I added Houston to the mix; Figure 3 displays the employment performance of the set which includes Connecticut Metros and the Houston metro area.
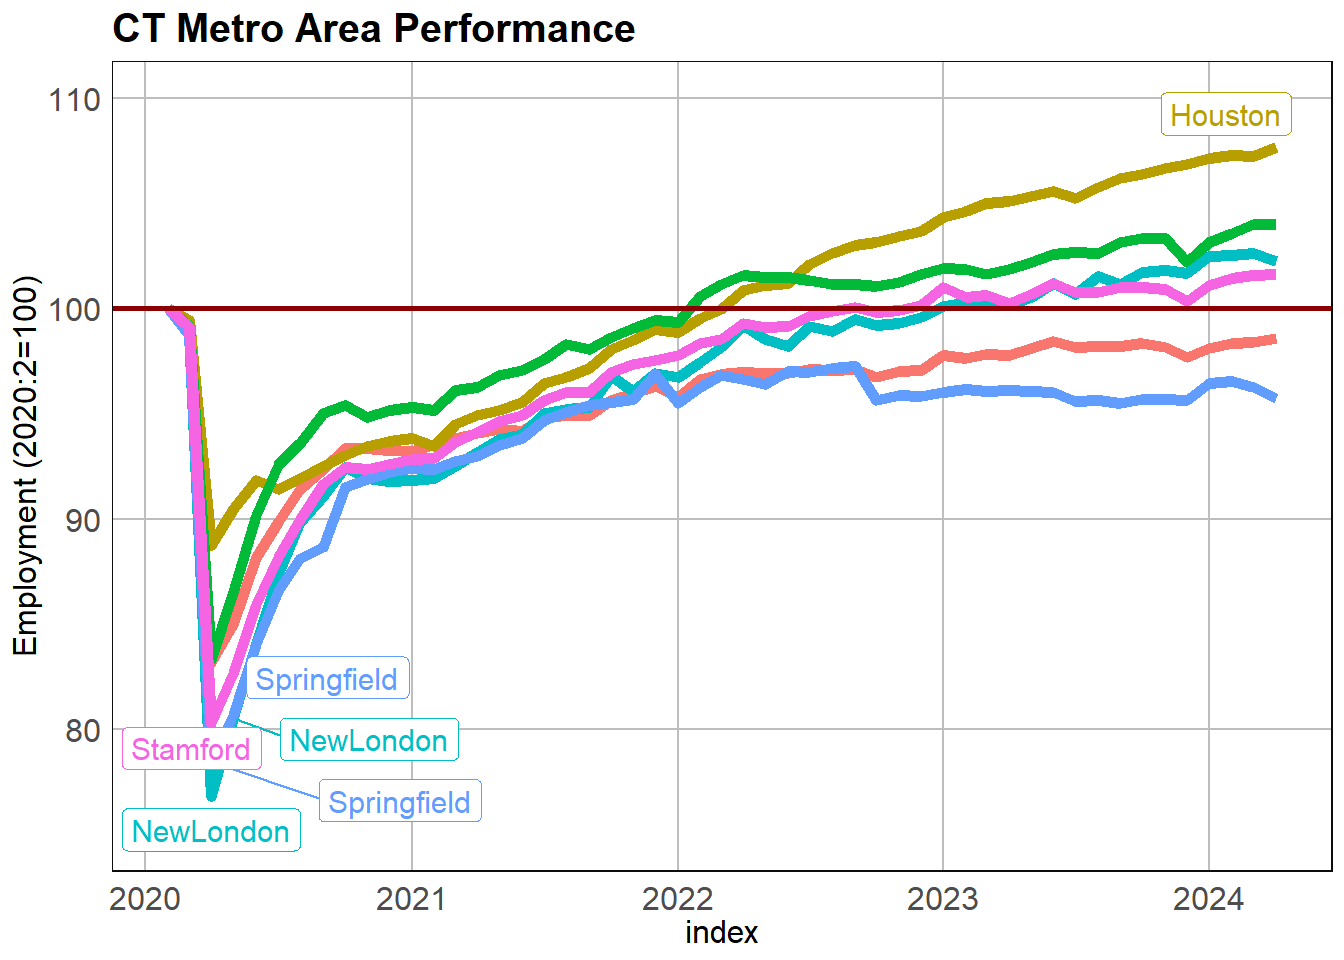
Again, as in Figure 1 above, the series are indexed; the baseline is set at 100 on February 2020; the darkred horizontal line sets the benchmark. Each of the series represents change in total employment relative to February 2020, the baseline. A line coursing below or above the horizontal lines set at 100 represents the particular area post-Covid performance. Anything below the horizontal line represents underperformance. The disparity in performance across our Metro areas is evident.
Why the asymmetry in recovery performance?
The differences in post-pandemic performance in the metro areas are notable. There appear to be a number of reasons.
1. Entering the Covid recession, the metro areas had different momentum propelling it; CT was consdierably slower.
2. Growth requires labor; the CT appears to be lacking and lacking in different proportions across its Metro areas; the high-performing just the opposite.
3. Observers have also flagged our anemic “dynamism,” an index that captures our ability to sort out our malaise.
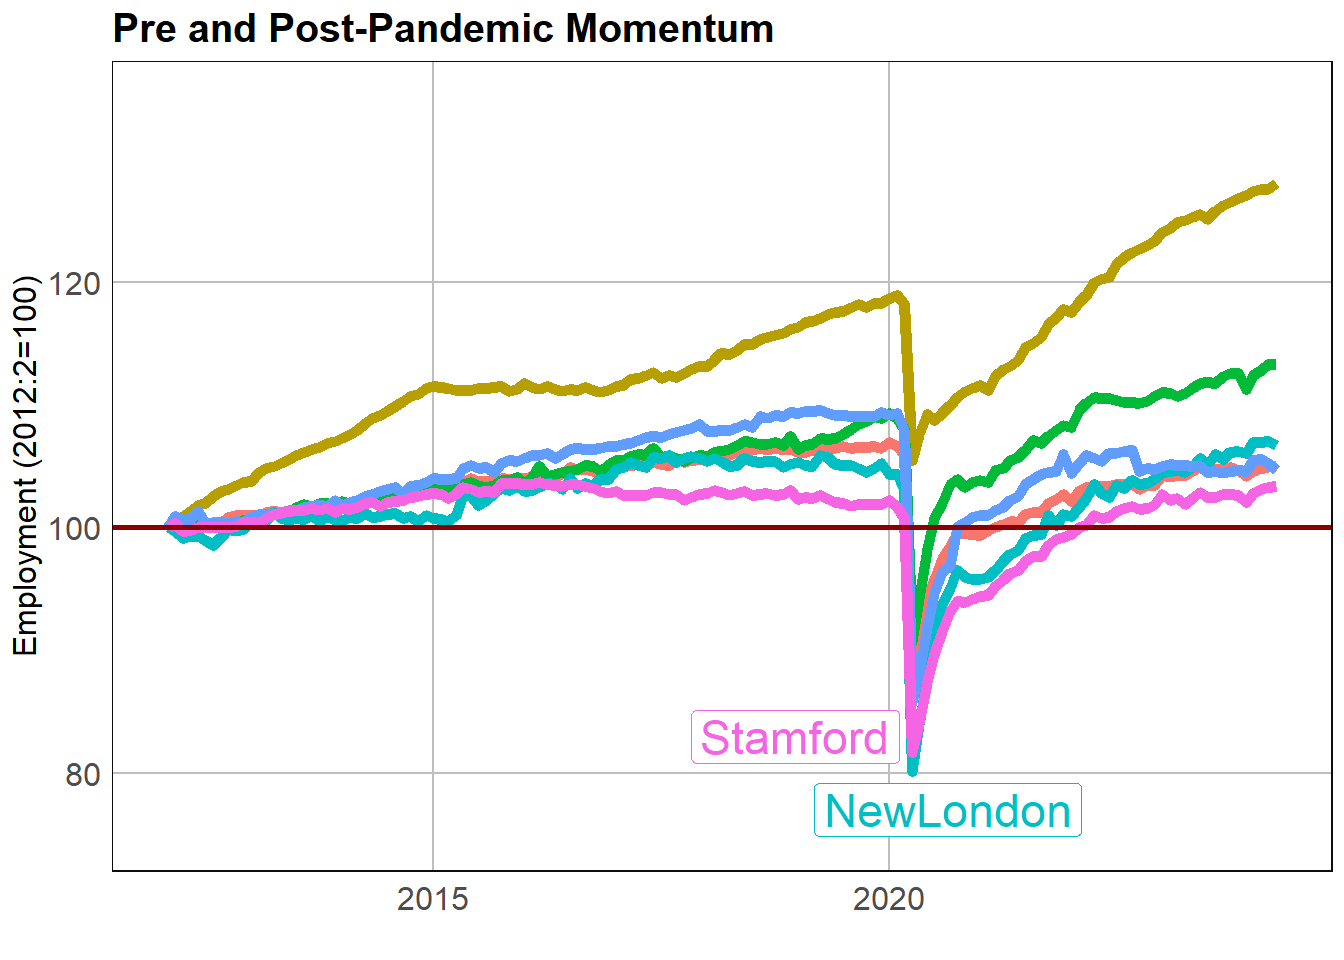
4. Nature of JobsFigure 4 provides a look at momentum. The Metro areas charged into the Covid storm with varying heads of steam. The figure provides a glimpse of the disparity. The rate of growth over the 12 year period prior to February 2020 in Houston was 25.8 percent; in Stamford it was 4.7 percent.
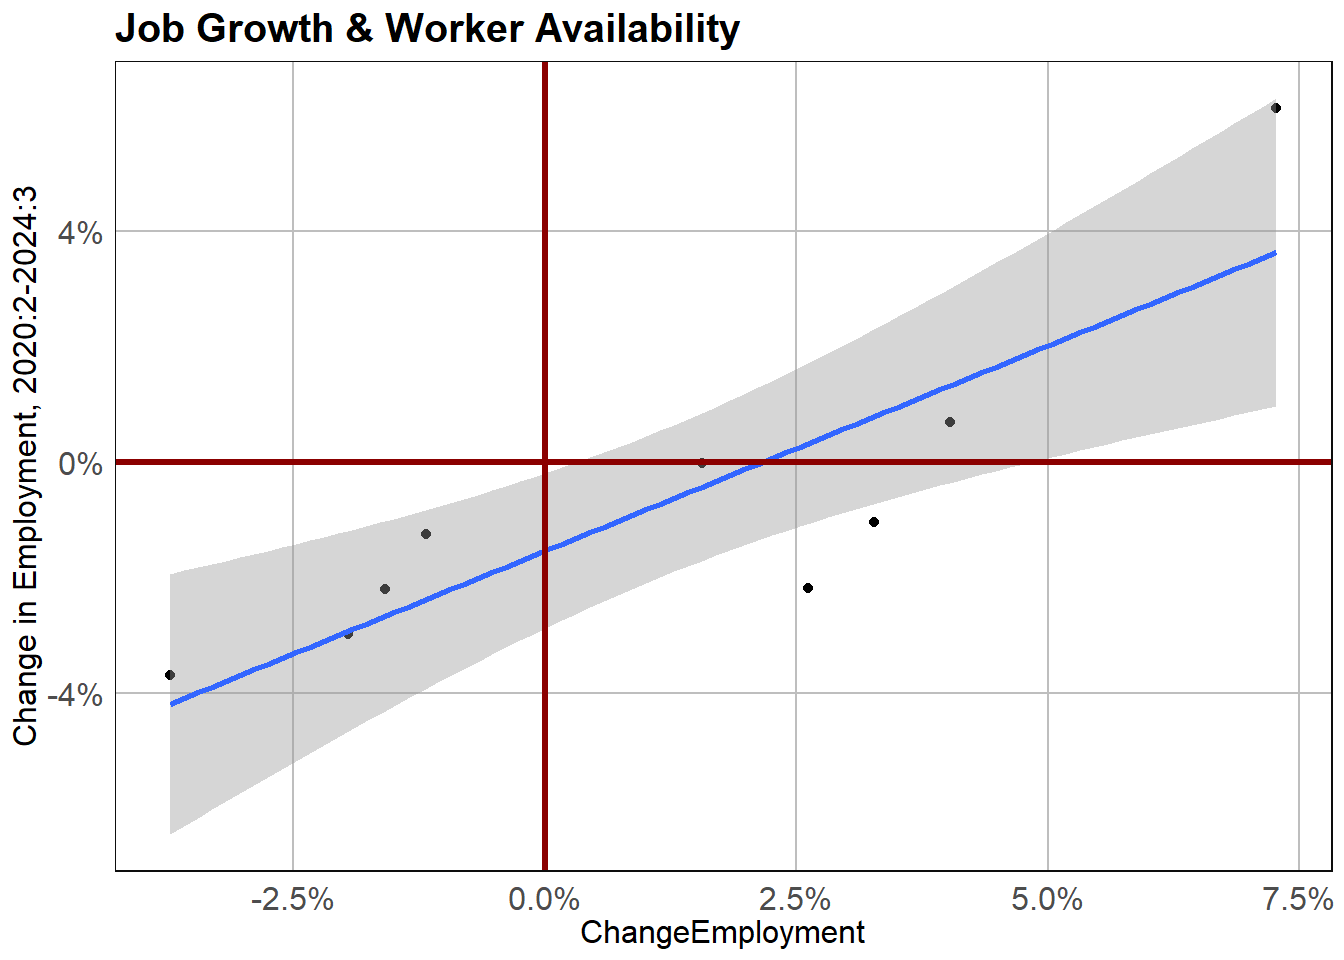
Another possible handicap is the supply of labor. The various CT metro areas do not appear to have the workers needed. Consider the following graph. It displays the relationship between employment growth and the availability of workers. It shows a positive relationship confirming how the lack of workers is constraining job growth in all metros albeit differently.
Industry Composition
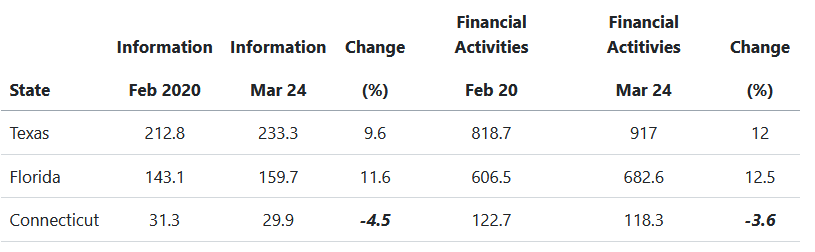
Take a look at two of Connecticut’s once historically succesful sectors: Information and Financial Activities. Compared to other states our performance is pitiful. But again, we were already limping along before the covid recession seemingly made things worse. Between Feb 2010 and Feb 2020 employment in Information declined 1.9 percent; Financial Activities dropped 9.1 percent. State
Looking from Afar
The view from other analysts just piles it on.
Economics Innovation Group
August Benzow at the Economics Innovation Group has an analysis on national job market growth that provides additional insight to the task here.
Metro areas that offer lower average wages but also promise more affordability are not just adding population but also adding jobs. In contrast, metro areas rich in amenities but expensive compared to many of their counterparts are far from the job growth rates they experienced before the pandemic. (Benzow, April 25, 2024)
The Economics Innovation Group tracks what they refer to as State Dynamism:
The concept of dynamism captures the intrinsic vitality of an economy: how quickly it changes, how efficiently it redeploys its resources to the most productive use, and how successfully it translates experimentation into opportunity. EIG
EIG’s Dynamism Score for Connecticut ranks us 34th in the nation; down from 23rd last year (note: EIG’s dynamism score is an inverted scale; dynamism increases as rank decreases); by the way NY ranks 46th; Mass ranks 20th. (EIG)
EIG offers the following diagnostic.
But a less dynamic economy tends to be less resilient to shocks, less innovative, less productive, and poorer in opportunity over the long-term.
Liberty Street Economics
Abel, et. all., at the Boston Fed, take a close, nationwide look at “the uneven geographic recovery from the pandemic regression, including why some places are finding it so difficult to recover.” And their results as to Connecticut and the Northeast are compatible with the point made here.
Their conclusions also corroborate ours:
The places that were growing more strongly before the pandemic have generally recovered and are growing more strongly today, while many places that lagged are still struggling to recover. Abel, et al. May 7, 2024
but they put it more colorfully: “The New Normal is the Old Normal.”
Concluding Comment
It appears to be clear. There was no good ’ol days before the pandemic; not in Connecticut. We were limping along at best and appear poised for more of the same. And yes: the New Normal is the Old Normal.
Sources:
All data used for the graphs is from FRED. Connecticut NonFarm Employment Data are from the Connecticut Department of Labor’s The Connecticut Economic Digest and its Labor Market Information website.
Abel, Jason R., Richard Deitz, Jonathan Hastings, and Joelle Scally, “Many Places Still Have Not Recovered from the Pandemic Recession,” in Liberty Street Economics, Federal Reserve Bank of New York (May 7, 2024).
Benzow, August., “While the national job market booms, high-wage metro areas are experiencing sluggish growth,” in Economic Innovation Group, Analysis, April 25, 2024.
Goldbeck, Dan, “The Biggest Week on Record,” Week in Regulation,” April 22, 2024.
Rodriguez, A.E., “Post-Recession Jobs Recovery: A State-Level Spatial Analysis,” Pennsylvania Law Review, V26, No1., Spring 2019).
Wall Street Journal, “The Government Spending Jobs Boom,” May 3, 2024.
A.E. Rodriguez, PhD Professor Economics & Business Analytics Pompea College of Business University of New Haven
arodriguez@newhaven.edu